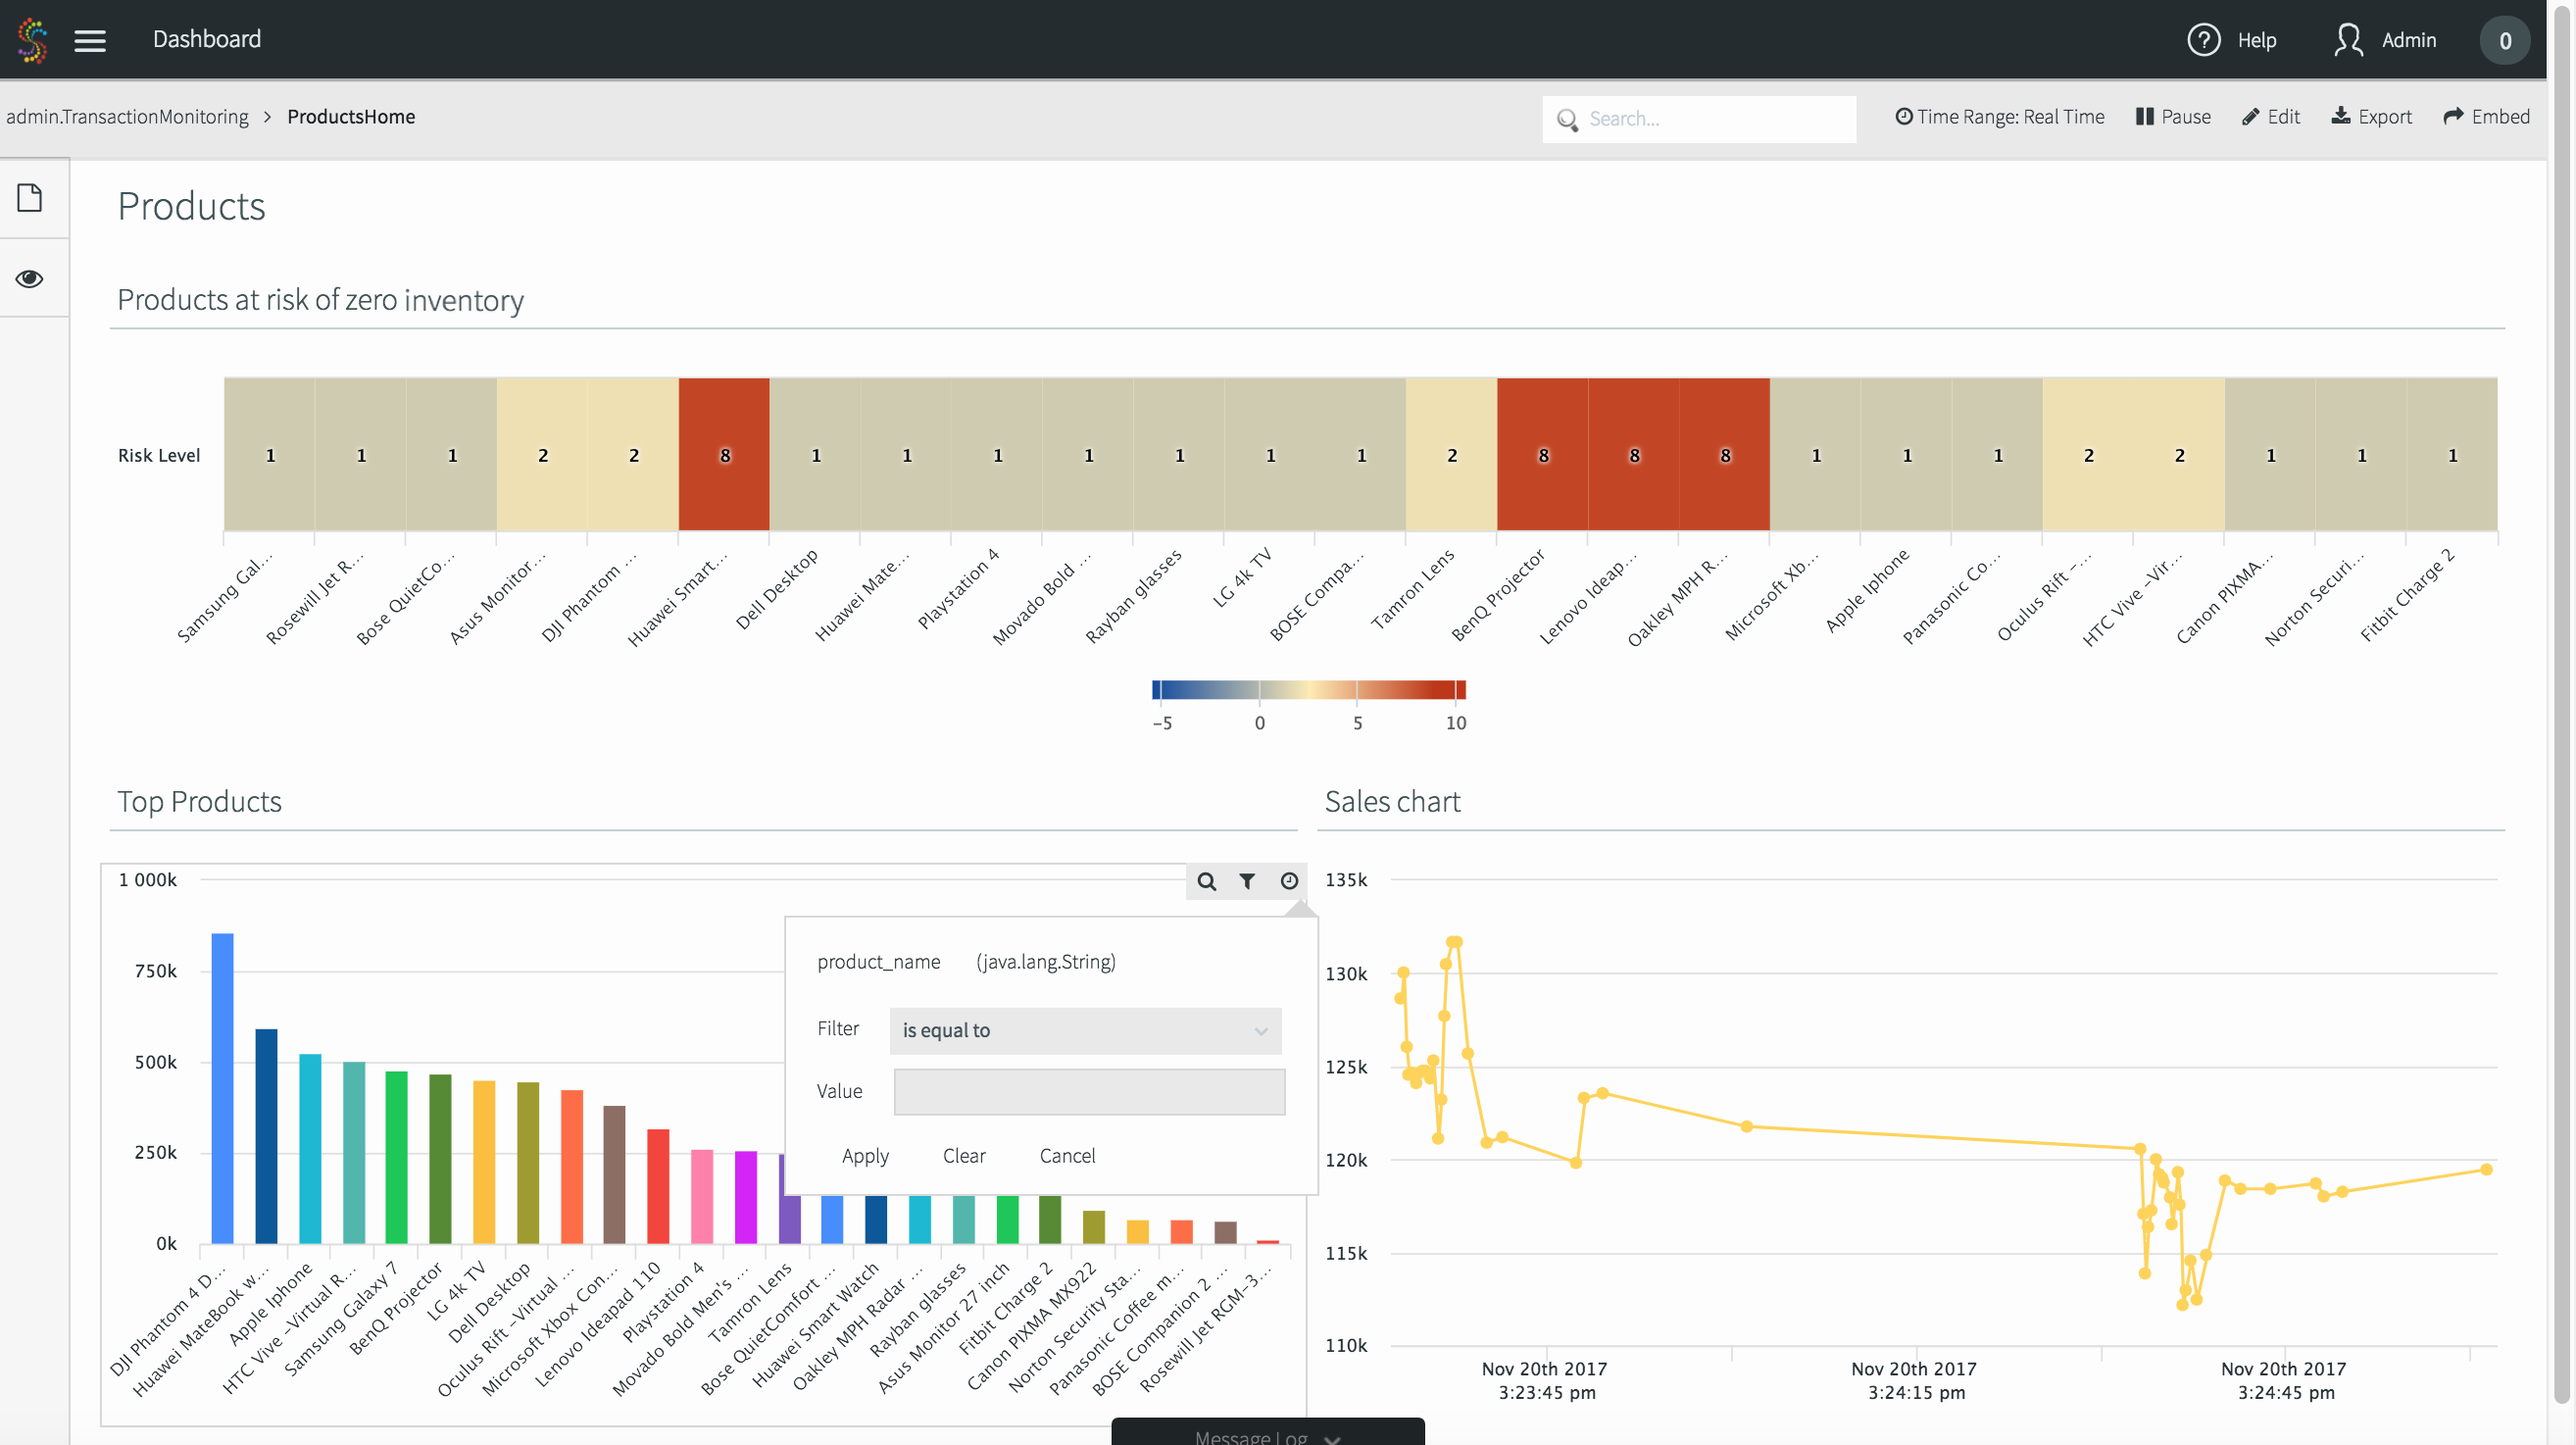
When business operations run at lightning speed generating large data volumes and operational complexity abounds, real-time data visualization and data exploration becomes increasingly critical to manage daily operations. Striim enables businesses to access, analyze, visualize and explore live operational data to understand their “Now,” and take control of business operations.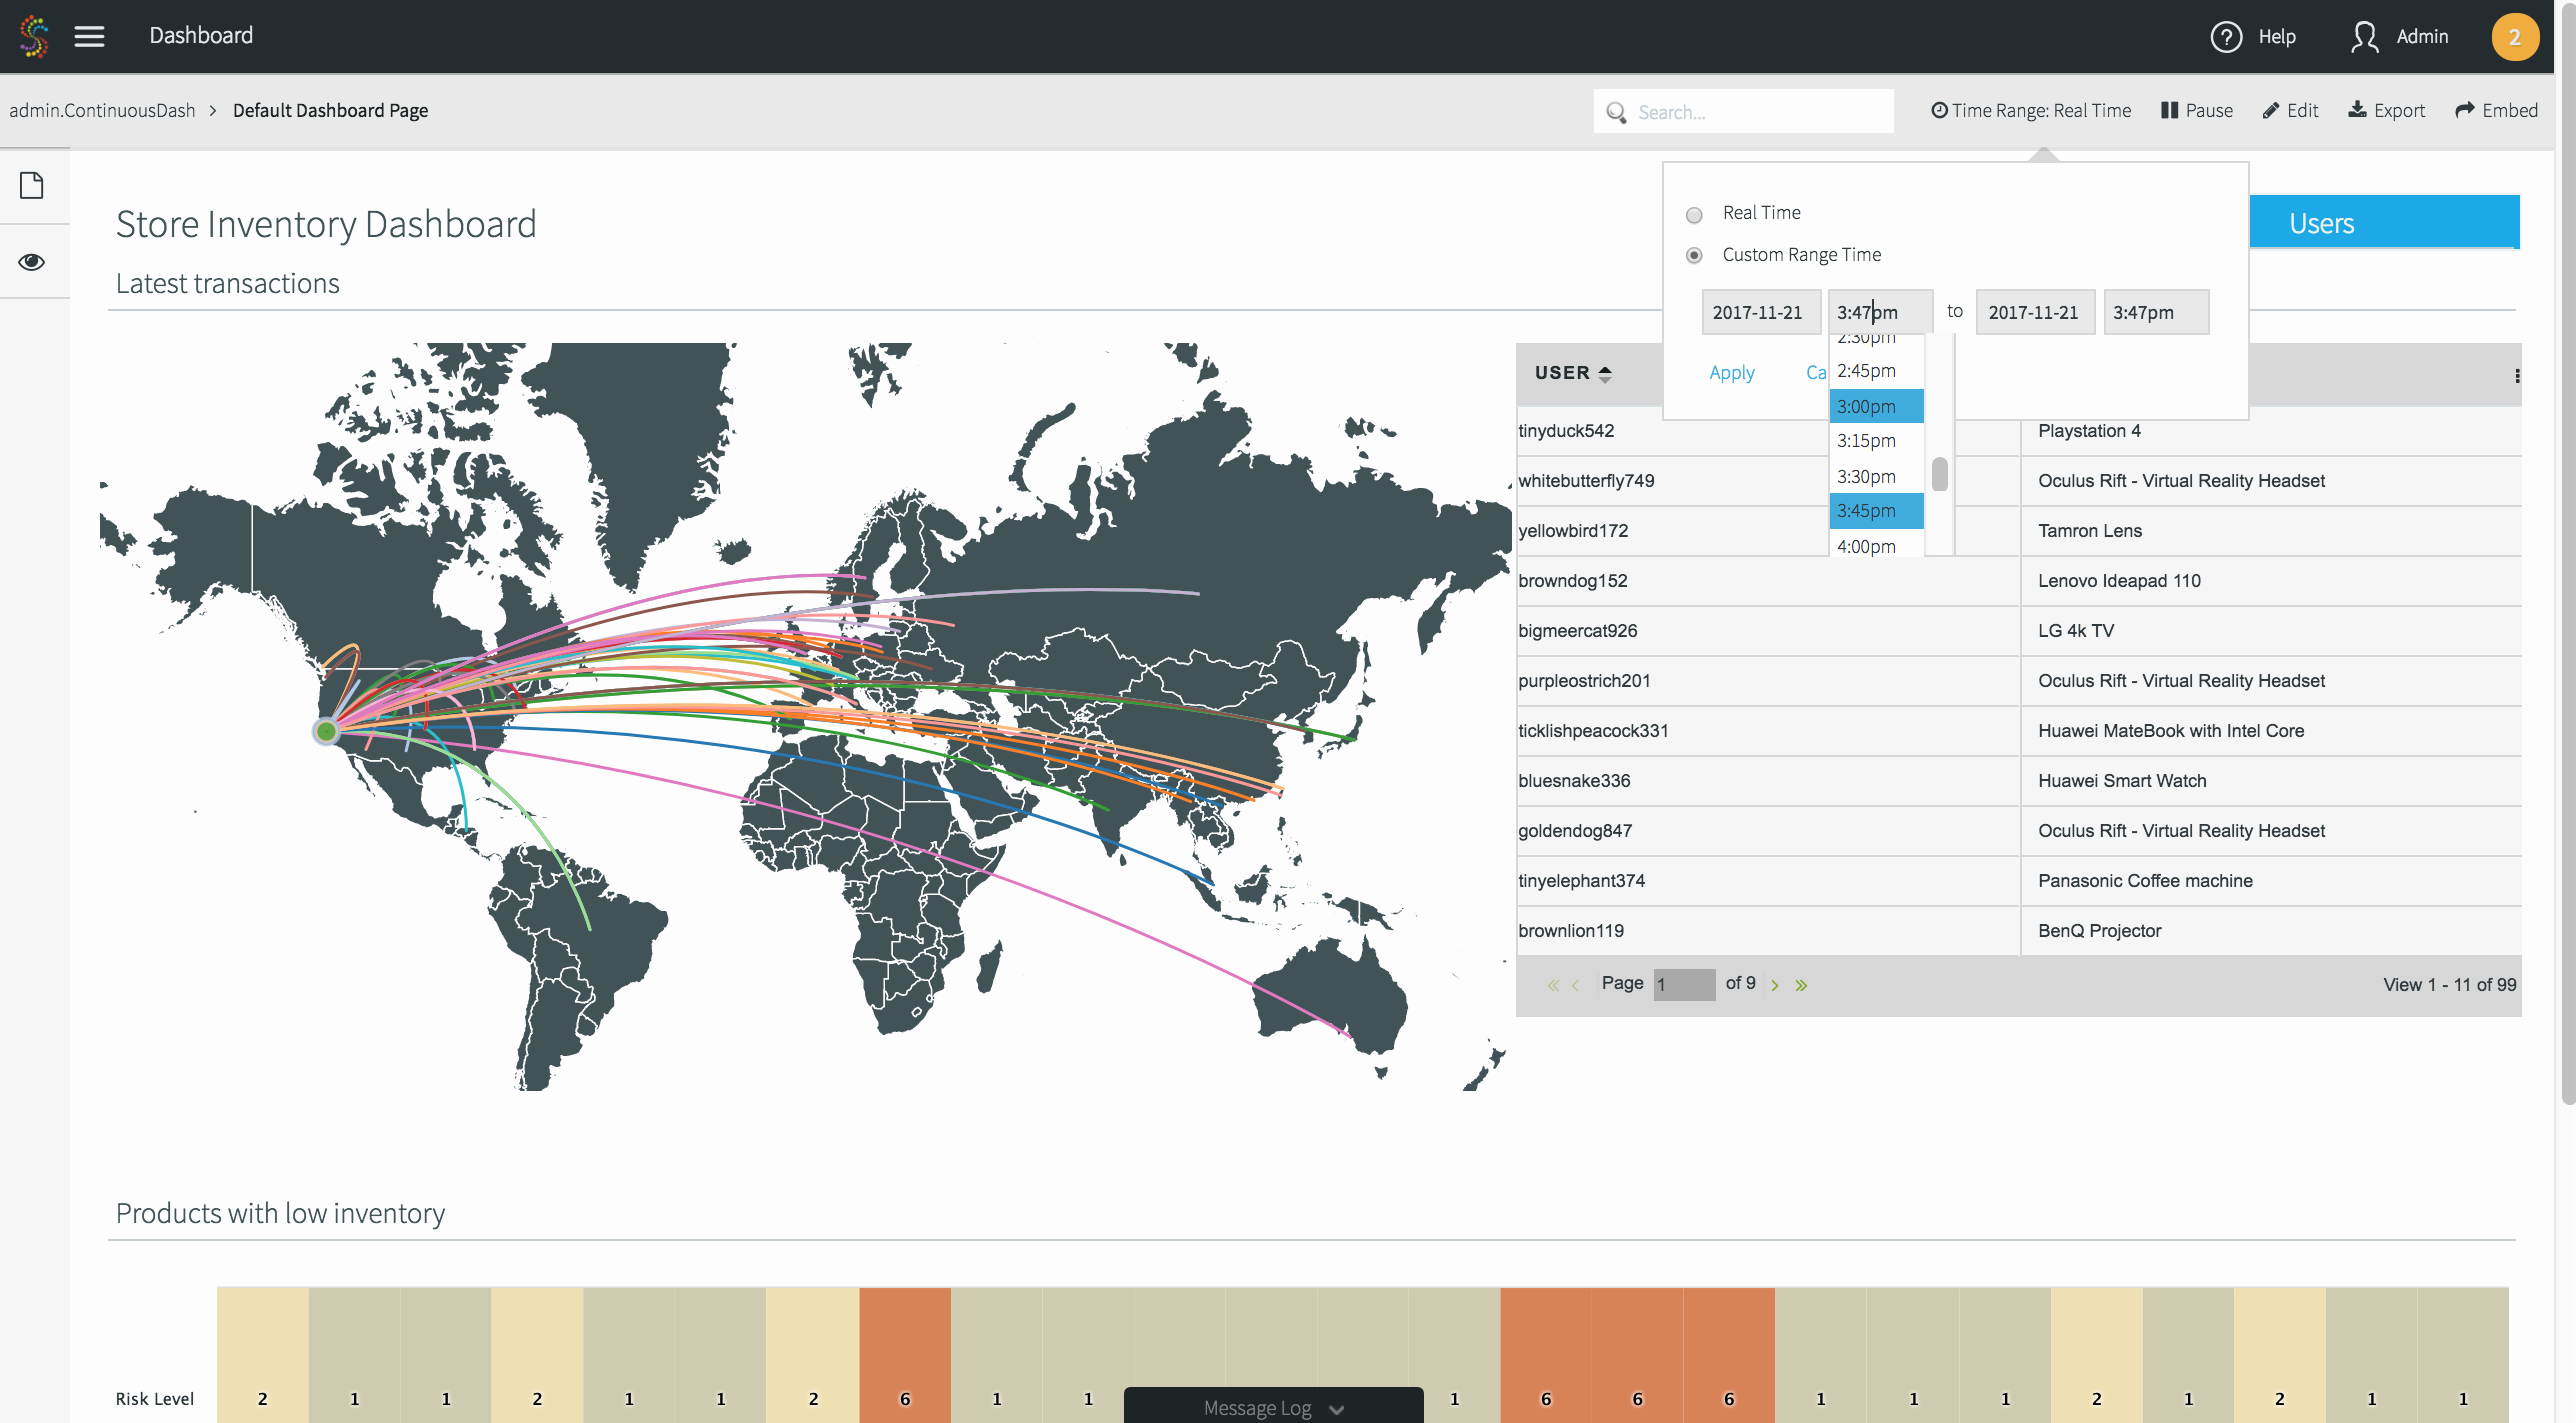
Real-Time, Comprehensive Insight Made Easy
By combining real-time data integration, streaming analytics, and rich data visualization in a single, enterprise-grade platform, Striim allows businesses to respond to business trends and emerging issues proactively and with full context. With Striim, users not only have up-to-the-second visibility into all corners of the business with advanced custom metrics, but also the flexibility to explore streaming data without needing to write code.
Create Sophisticated Metrics Easily
Unlike packaged solutions with fixed and generic metrics, Striim’s software platform gives businesses the flexibility to gain fast and deep insight using business-specific metrics. By ingesting, filtering, aggregating, transforming, enriching, and analyzing real-time data from virtually any source, it enables custom metrics using all relevant data and the ability to dice and slice the metrics across a wide range of dimensions for fast insight. A comprehensive set of built-in SQL operations and functions – such as Math, Statistics, Date, Spatial, String – along with customizable, jumping and sliding time windowsprovide the granular and precise metric definitions that deliver accurate performance assessment.
Gain Real-Time and Flexible Visibility into Operations
By combining streaming integration and analytics capabilities with in-memory processing, Striim updates all metrics in real time as new data streams in from various sources, and stores historical data within the built-in results store for time-based comparisons.
Via the dashboards, users can compare live data to historical averages or to a specific date and time in the past, without having to write code. Real-time, interactive dashboards allow business users to view live data with detailed field and time-based filtering at the page or chart level. In addition, users can search streaming data directly on the dashboard and drill down to detail pages.
Key Platform Features for Real-Time Data Visualization and Data Exploration
Striim offers an end-to-end, enterprise-grade platform to deliver instant insights from high-volume, high-velocity data. Some of the key features for real-time data visualization and data exploration are as follows:
- Real-time data ingestion from diverse sources: Ingests, processes, and enriches unstructured, semi-structured, and structured data from databases, log files, message queues, and sensors
- Multi-source stream processing and analytics: Performs SQL-based continuous processing on multiple streams of live data including enrichment with static and streaming reference data
- Flexible time windows: Offers time-based, event-based, and session-based windowing
- Interactive, live dashboards: Delivers push-based visualization with automatic refresh
- Rewinding: Enables to view and compare historical data via the UI
- Search: Offers keyword search on live, streaming data
- Field and time-based filtering: Allows filtering and comparing each chart by different dimensions
- Page and chart level filtering: Gives the flexibility to use filter at the chart or page level
- Embedding into custom websites: Striim charts can be embedded into any HTML5 page via iFrame along with filtering and search capabilities.
Deploy and Modify Easily as Business Needs Change
Businesses can quickly gain real-time visibility into their operations via Striim’s intuitive UI without any coding. Using Striim’s simple yet powerful streaming SQL engine, Striim applications can ingest millions of data points per second and create visualization-specific aggregates. Striim’s GUI and SQL-based language makes it easy to correlate live, streaming data with historical aggregates.
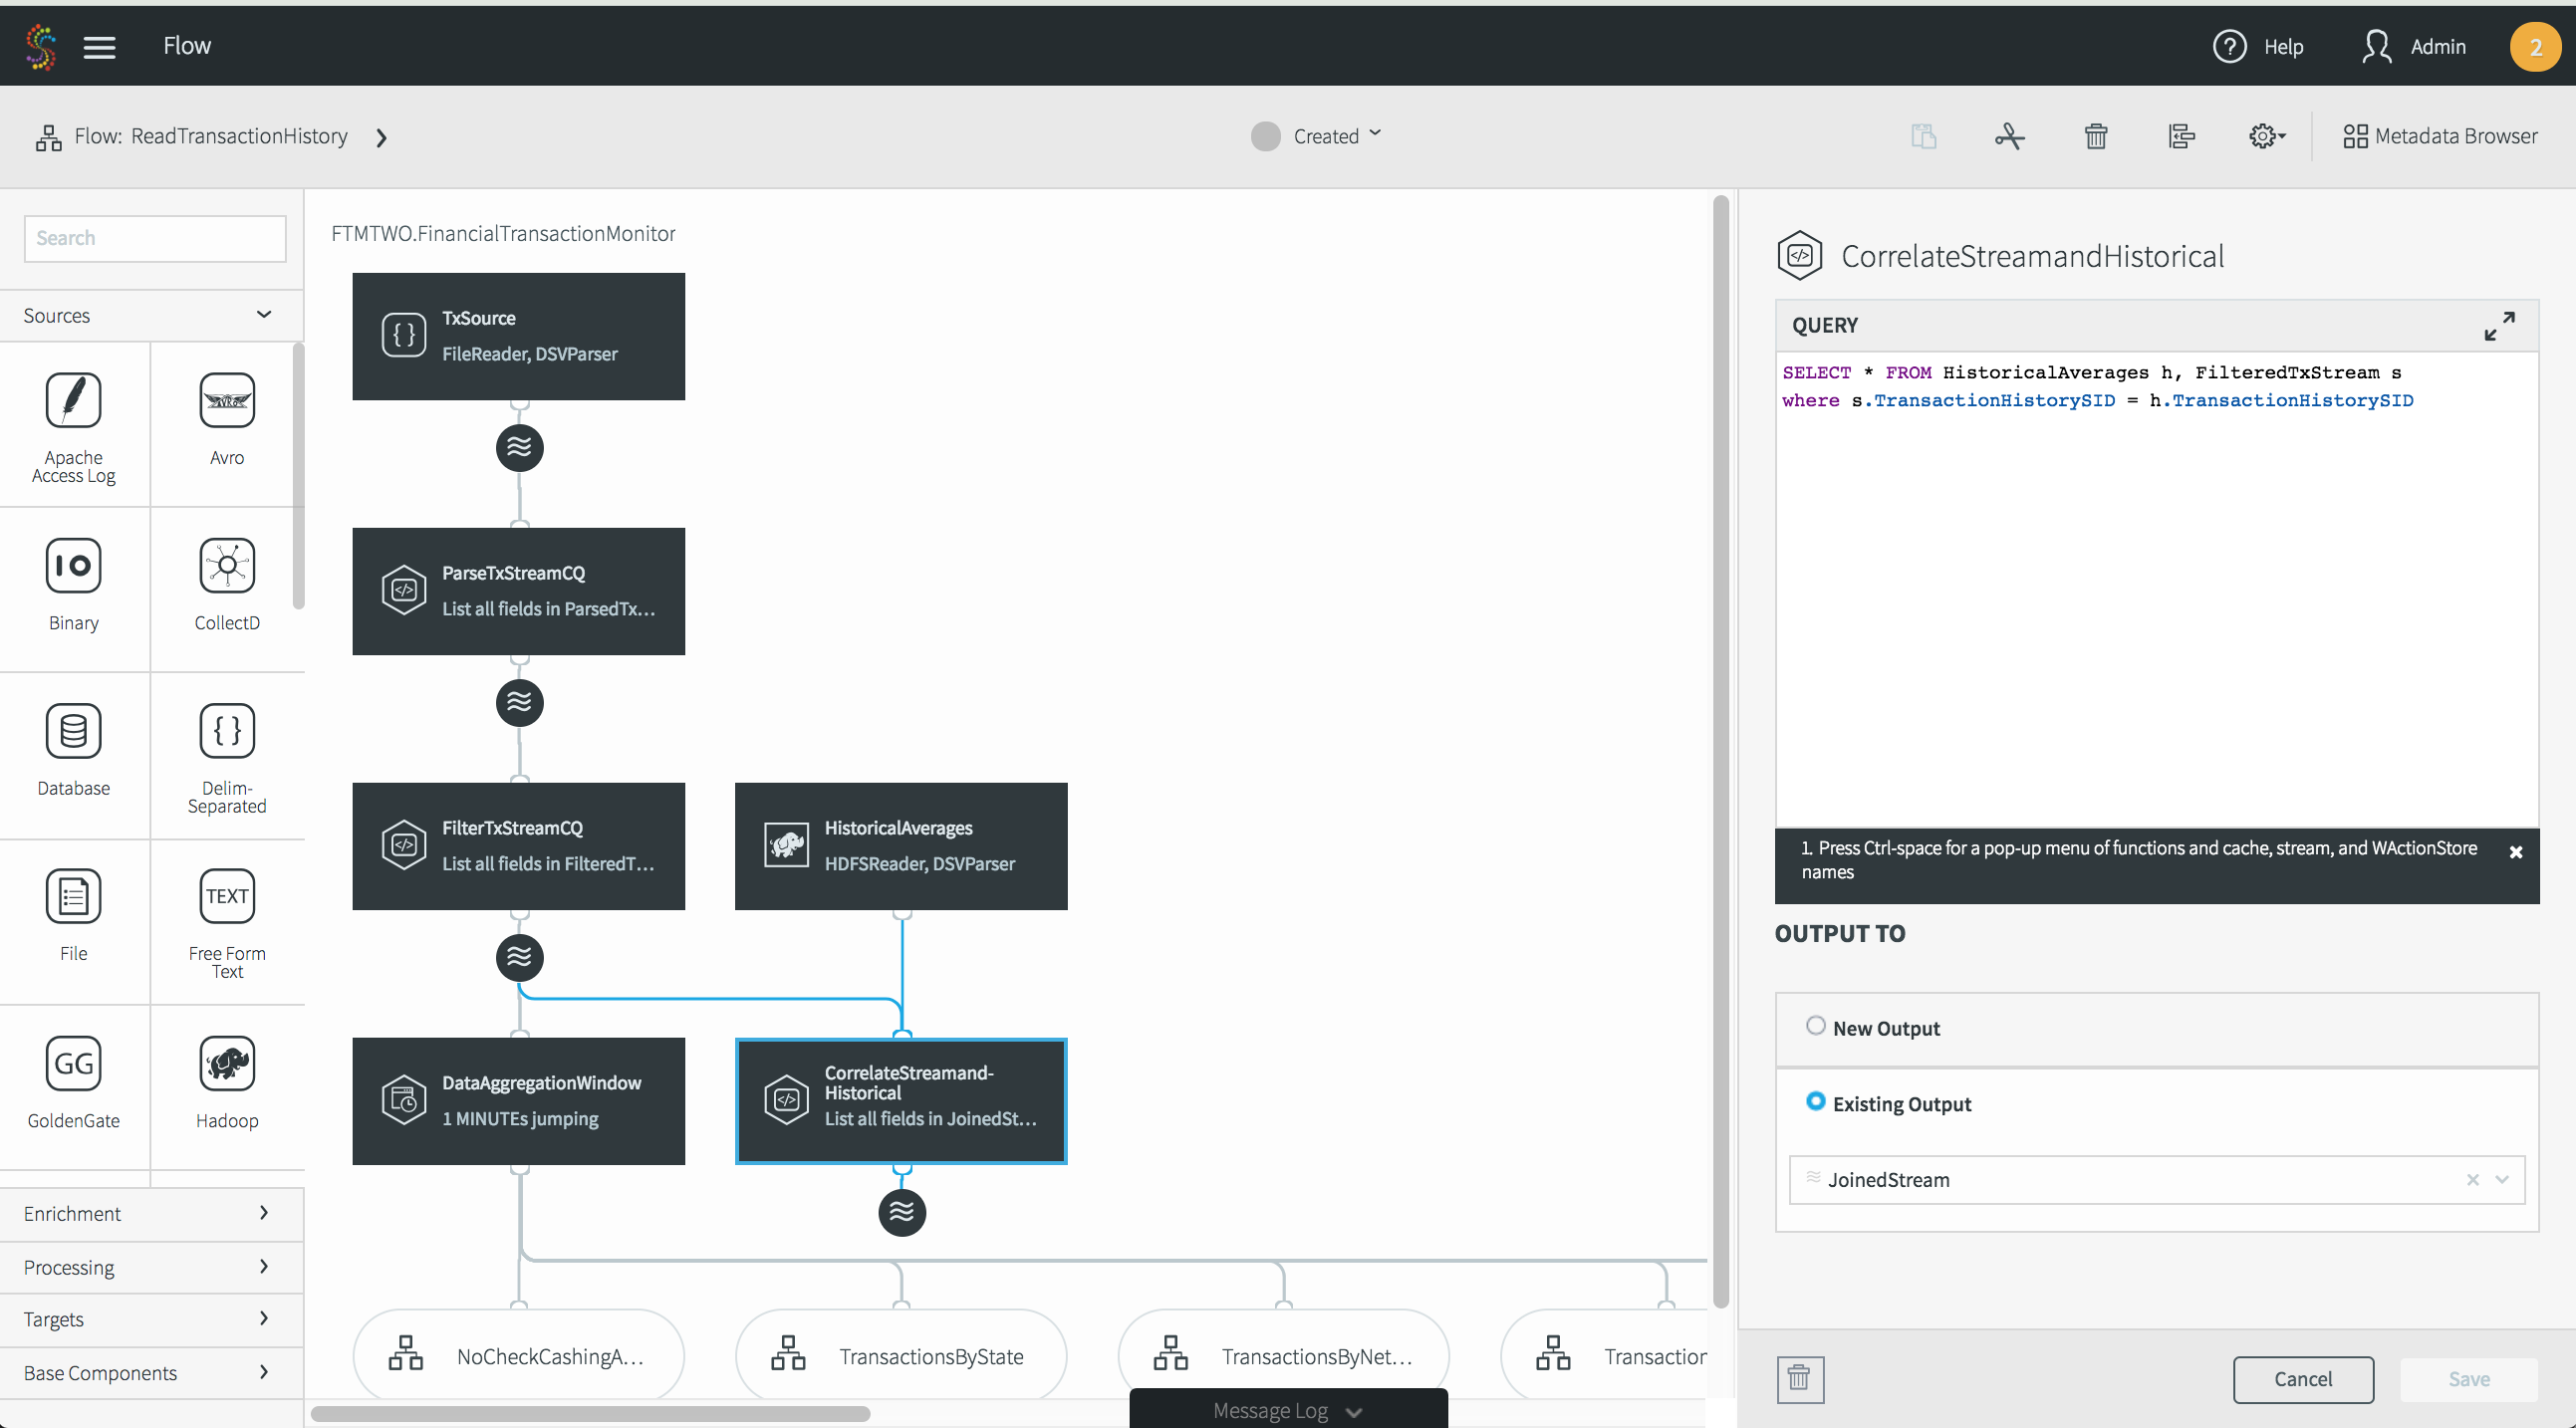
Within seconds of establishing data sources and flows, users can create dashboards to view live data, and modify the dashboards and charts as needed to meet ever-changing business needs. Visualizations can be done via a variety of charts such line, area, column, maps, heat maps, tables etc. Dashboards can contain multiple pages with in-page filtering and drill down available for deeper understanding of operational metrics.
Striim’s charts can be embedded to any custom dashboard or web page to support broad collaboration and distribution of real-time insights. Striim issues real-time alerts based on custom thresholds, and can trigger workflows to enable timely action.
Benefits of Data Exploration with Striim
Using Striim for live operational dashboards and streaming data exploration, businesses gain several competitive advantages including:
- Real-time, granular, and comprehensive insights with business-specific metrics
- Correlation of real-time and historical data to detect deviations immediately
- Rapid iteration of the dashboards and data flows as business needs change
- Proactive response to emerging trends based on in-time, in-context insights
- The ability to easily meet strict SLAs and improve customer experience
Striim enables businesses to accurately track operational performance with the right metrics, in real time, so they can course-correct fast, with full confidence.
To learn more about Striim’s real-time data visualization and data exploration capabilities, visit our Creating and Monitoring Operational Metrics solutions page, schedule a demo with a Striim technologist, or download a free trial of the platform and try it for yourself!


