Console commands
Using the console in the web UI
At the bottom of the Console page, enter a command, then click Execute.
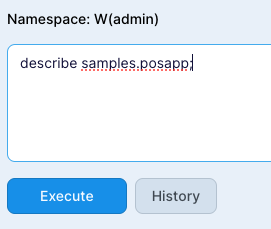
The command's output will appear above.
If a command requires a file as an argument, upload it as described in Manage Striim - Files. Specify the path as UploadedFiles/<user name>/<file name>, for example, UploadedFiles/MyUserName/MyApp.tql.
In this release, SELECT commands (ad-hoc queries) are not supported in the web console.
Using the console in a terminal or command prompt
If Striim is installed in /opt, the command to run the console is:
/opt/Striim/bin/console.sh -c <cluster name>
In Windows, if Striim is installed in c:\striim, the command to run the console is:
\striim\bin\console -c <cluster name>
Note
For the Windows command prompt, set the font to Consola, Lucida Console, or another monospace font that has box-drawing characters.
The following switches may be used:
-c <cluster name>: the name of the cluster to connect to (if omitted, will default to the current user name)
-f <path><file name>.tql: a TQL file containing commands to run when console starts (if not specified from root, path is relative to the Striim program directory)
-H false: if HTTPS has been disabled, use this to connect to Striim using HTTP
-i <IP address>: if the system has multiple IP addresses, specify the one for the console to use
-p <password>: the password to use to log in (if omitted, you will be prompted after the console connects)
-S <IP address>: the IP address of the Striim server (the value of ServerNodeAddress in startUp.properties; required if HTTP has been disabled)
-t <port>: specify the HTTP port if not 9080
-T <port>: specify the HTTPS port if not 9081
-u <user name>: the user to log in as (if omitted, you will be prompted after the console connects)
The following commands are intended primarily for use at the command line rather than in .tql application files. DDL and component reference and ad-hoc queries may also be entered at the command line.
@
@<path>/<file name>.tql [passphrase=<passphrase>];
Run the commands in the specified TQL file (typically all the commands required to create an application). If not specified from root, path is relative to the Striim program directory. If the TQL was exported with a passphrase, specify it with the passphrase option. Note that if the file contains DDL defining an application, the name will be defined by the CREATE APPLICATION statement, not the TQL file name.
DEPLOY
Deploys an application in the Created state. See Managing deployment groups.
DESCRIBE
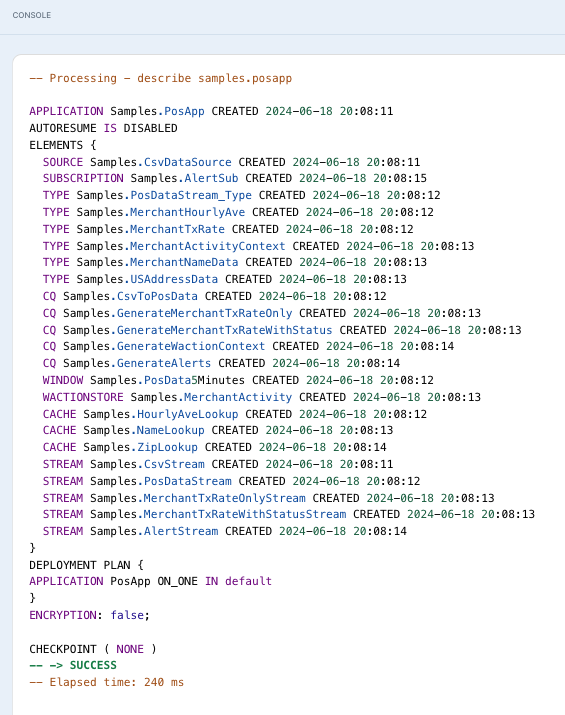
DESCRIBE <namespace>.<object name>;
Returns all properties of the specified component, application, or flow. DESCRIBE CLUSTER; returns the cluster name, information about the metadata repository, and license details.
EXPORT
EXPORT APPLICATION { ALL | <namespace>.<application name>,... } [ TO "<path>" [passphrase="<passphrase>" ]];Exports applications as TQL files. Specify either ALL to export all applications or a list of applications separated by commas. See Encrypted passwords for discussion of passphrases. If you do not specify a path, files will be saved to the striim directory.
Except for applications in the current namespace when the command is run, component names in the exported TQL will include their namespaces. Remove those before importing the TQL into a different namespace.
EXPORT <stream name>;
HISTORY
HISTORY;
Lists all commands previously entered in the current console session.
IMPORT
Optionally, standard Java classes may be imported into TQL applications and their functions used in TQL statements. For an example, see Using analytics and regression functions.
LIST
LIST { <component type> };Returns a list of all objects of the specified type.
LIST LIBRARIES;
Lists currently loaded open processors (see Loading and unloading open processors).
LOAD / UNLOAD
See Loading standalone sources, caches, and WActionStores, or Creating an open processor component.
METER
Usage-based metering continuously tracks resource consumption by the apps in a Striim cluster. You can use this information to track your usage breakdowns at an app and adapter level. With Striim Cloud, you can also view usage rate information that can help you track how you will be billed for usage charges.
Show billing and metering cycle information
METER CYCLE -billing;
Lists the billing cycles.
METER CYCLE -metering <billingId>;
Lists the metering cycles for the billing cycle billingId.
Show usage information
METER USAGE -summary;
Lists the usage summaries for all billing cycles.
METER USAGE -byapp <billingId>;
Lists the usage and consumption for all applications in the billing cycle billingId.
METER USAGE -bycycle -app <appId | appName>;
Lists the usage and consumption for the application appId/appName in all billing cycles
METER USAGE -current;
Lists the usage and consumption for all adapters in the current billing cycle.
METER USAGE -current -app <appId | appName>;
List the usage and consumptions for all adapters in the application appId/appName and the current billing cycle.
METER USAGE -itemized <billingId>;
List the usage and consumptions for all adapters in the billing cycle billingId.
METER USAGE -itemized <billingId> -app <appId | appName>;
List the usage and consumptions for all adapters in the application appId/appName and the billing cycle billingIdbillingId.
Show consumption information
METER CONSUMPTION -aggregated <billingId> <itemId>;
List the consumptions for all components in the billing cycle billingId and the adapter itemId.
METER CONSUMPTION -aggregated <billingId> <itemId> -app <appId | appName>;
List the consumptions for all components in the billing cycle billingId, the adapter itemId and the application appId/appName.
METER CONSUMPTION -drilled <billingId> -component <componentId | componentName>;
List the consumptions for the component componentId/componentName in the billing cycle billingId drilled down to the metering cycles.
Show usage rate information
The METER RATE commands apply to Striim Cloud with its usage-based billing. Rates are not applicable to Striim Platform. Usage has two parts:
Consumption usage: Consumptions from the flow components are converted to usage based on a predetermined formula for their consumption types.
Feature usage: Usage for each subscribed add-on feature is calculated by applying an acceleration factor on top of the total consumption-based usage.
METER RATE -adapter;
List the usage rates and acceleration factors for different adapter tiers.
METER RATE -storage;
List the usage rates for storage consumptions.
METER RATE -feature;
List the usage accelerator factors for the features.
METER RATE -item <itemId>;
List the metering rate and unit for the usage item itemId.
Show applications, adapters and components
METER LIST -app;
Lists the metered applications.
METER LIST -adapter;
Lists all adapters.
METER LIST -adapter -used;
List the used and metered adapters.
METER LIST -component;
List the metered components, active and dropped.
METER LIST -component -active;
List the metered components, active only.
Show configuration
METER CONFIG -kafka;
Describes the configuration of the internal Kafka cluster used by persistent streams.
MONITOR
PREVIEW
PREVIEW <namespace>.<CQ name> { INPUT | OUTPUT | INPUTOUTPUT } [LIMIT <maximum number of events>]Returns current input and/or output events for the specified CQ. If you do not specify value for LIMIT, the command will return a maximum of 1000 input events and/or 1000 output events.
Note
The CQ must be running before you execute the PREVIEW command.
Each event in the command's output includes:
Source: name of the component that emitted the event (either one of the components in the FROM clause of the CQ or the CQ itself)
IO: I for input or O for output
Action: added or removed
Server: name of the server executing the specified CQ
Data: the event payload
For example, the command PREVIEW Samples.PosData5Minutes inputoutput limit 1; will return something similar to:
Processing - preview samples.CsvToPosData inputoutput limit 1
Source:"Samples.CsvStream",IO:"I",Action:"added",Server:"S192_168_7_91",
Data:"[[COMPANY 366761, 9XGDirhiN2UPnJ9w5GqmISM2QXe1Coav3Fq, 0558659360821268472, 6,
20130312174714, 0615, USD, 8.42, 8641415475152637, 61064, Polo],
{FileOffset=0, RecordEnd=49798966, RecordOffset=49798836, FileName=posdata.csv,
RecordStatus=VALID_RECORD}]"
Source:"Samples.CsvToPosData",IO:"O",Action:"added",Server:"S192_168_7_91",
Data:"[9XGDirhiN2UPnJ9w5GqmISM2QXe1Coav3Fq, 2013-03-12T17:47:14.000-07:00, 17, 8.42, 61064];"
QUIESCE
QUIESCE <namespace>.<application name> [CASCADE];
Pauses all sources.
Flushes out all data in process. This can result in partial batches of events, such as a 100-event window emitting a batch of only 20 events, or a five-minute window emitting a one-minute batch, which may result in functions such as COUNT and SUM returning anomalous results outside of the normal range. Pattern matching CQs may also return anomalous results.
After all data is flushed, records all information required for recovery, if it is enabled (see Recovering applications).
Stops the application. Its status will be QUIESCED.
If you specify the CASCADE option, any downstream applications that consume events from the specified application via persisted streams will also be quiesced.
Note
If when you start an application for the first time it reads from a persisted stream that was previously quiesced, it will start reading the stream after the point at which it was most recently quiesced. Similarly, if an application was offline when an upstream application was quiesced, when it gets to the quiesce command in the persisted stream it will quiesce.
The primary uses for QUIESCE are to flush out remaining data at the end of a data set and to create a recovery checkpoint with no data in process prior to using ALTER on an application with recovery enabled (see ALTER and RECOMPILE).
Due to long-running open transactions, OracleReader may be unable to pause within 30 seconds, in which case the application and all its sources will resume as if the QUIESCE command had not been issued.
To support QUIESCE with OracleReader, see Creating the QUIESCEMARKER table for Oracle Reader.
REPORT
RESUME
When an application is in the TERMINATED state and the condition that caused it to terminate has been corrected, RESUME <application name>; will attempt to resume operation from the point where the application terminated. Data may be lost if recovery was not enabled (see Recovering applications).
SELECT
Queries a WActionStore. See Browsing data with ad-hoc queries.
SHOW
Show current stream output
SHOW <namespace>.<stream name>;
Returns the output of a stream. Press Ctrl-D to end.
Show open transactions in Oracle Reader
With OracleReader, SHOW can also be used for Viewing open transactions.
Show checkpoint history
Show OJet status and memory usage
START
START <namespace>.<application name>;
Starts the specified application.
STATUS
STATUS <server name>;
Lists all applications deployed or running on the specified server.
STATUS <namespace>.<application name>;
Returns the status of the specified application. See Application states.
STOP
STOP <namespace>.<application name>;
Stops a running application and, if recovery is enabled, writes recovery checkpoints. If recovery is enabled and the application was not dropped after it was stopped, recoverable sources will restart from the point immediately after the last written events (see Recovering applications). If recovery is not enabled, any data currently being processed will be lost.
The Stop command is also available when an application is in the Starting state. This can be useful when an application is stuck in the Starting state and you want to stop and debug it rather than waiting for it to time out and revert to the Deployed state.
UNDEPLOY
Undeploys a deployed application. See Managing deployment groups.
The Undeploy command is also available when an application is in the Deploying state. This can be useful when an application is stuck in the Deploying state and you want to stop and debug it rather than waiting for it to time out and revert to the Created state.
UNLOAD
See Loading standalone sources, caches, and WActionStores, or Creating an open processor component.
USAGE
USAGE [<namespace>.<application name>];
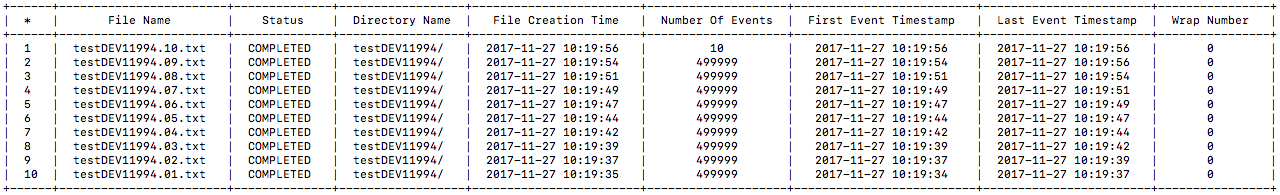
Lists sources and how much total data each has acquired. If you do not specify an application name, USAGE; lists all sources for all applications.
Browsing data with ad-hoc queries
Ad-hoc queries let you do free-form queries on WActionStores, caches, or streams in real time by entering select statements in the Tungsten console. The syntax is the same as for queries in TQL applications (see CREATE CQ (query)).
Load, deploy, and start the PosApp sample application.
Open a terminal window and start the Tungsten console. If Striim is installed in
/opt, the command is:/opt/Striim/bin/console.shLog in with username
adminand the password you provided when you installed Striim.At the W (admin) > prompt, enter the following:
SELECT * FROM MerchantActivity WHERE Zip="12244";You should see output starting with the following:[ MerchantId = 3f1rHIwpOARsfcwrSl8MuL6hp6h7MSoIwjU StartTime = 2013-03-12T17:47:18.000-07:00 CompanyName = Hickory Farms Inc. Category = COLD Status = OK Count = 43 HourlyAve = 50 UpperLimit = 75.0 LowerLimit = 33.61111111111111 Zip = 12244 City = Albany State = New^York LatVal = 42.6149 LongVal = -73.9708 ] ...
Press Enter to exit the query.