Web UI Guide
Web UI Overview
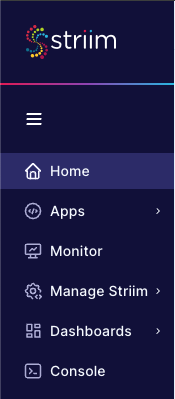
The menu at the upper left corner of the Striim web UI allows you to navigate to the UI's various pages. An administrator will see the six choices shown above. Users with limited permissions may see fewer choices.
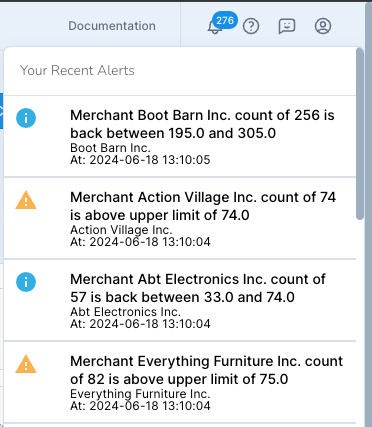
The menu at the top right of the Striim web UI lets you view the documentation in HTML or PDF format (see www.striim.com/docs for the latest update), view alerts, see information about Striim or your user account, contact support, or log out.
When you have alerts, the Alert (bell) icon will display a number. Click the icon to see a list of the alert. The alerts above are from the PosApp sample application.
At the bottom of the web UI is the Message Log.
Home page
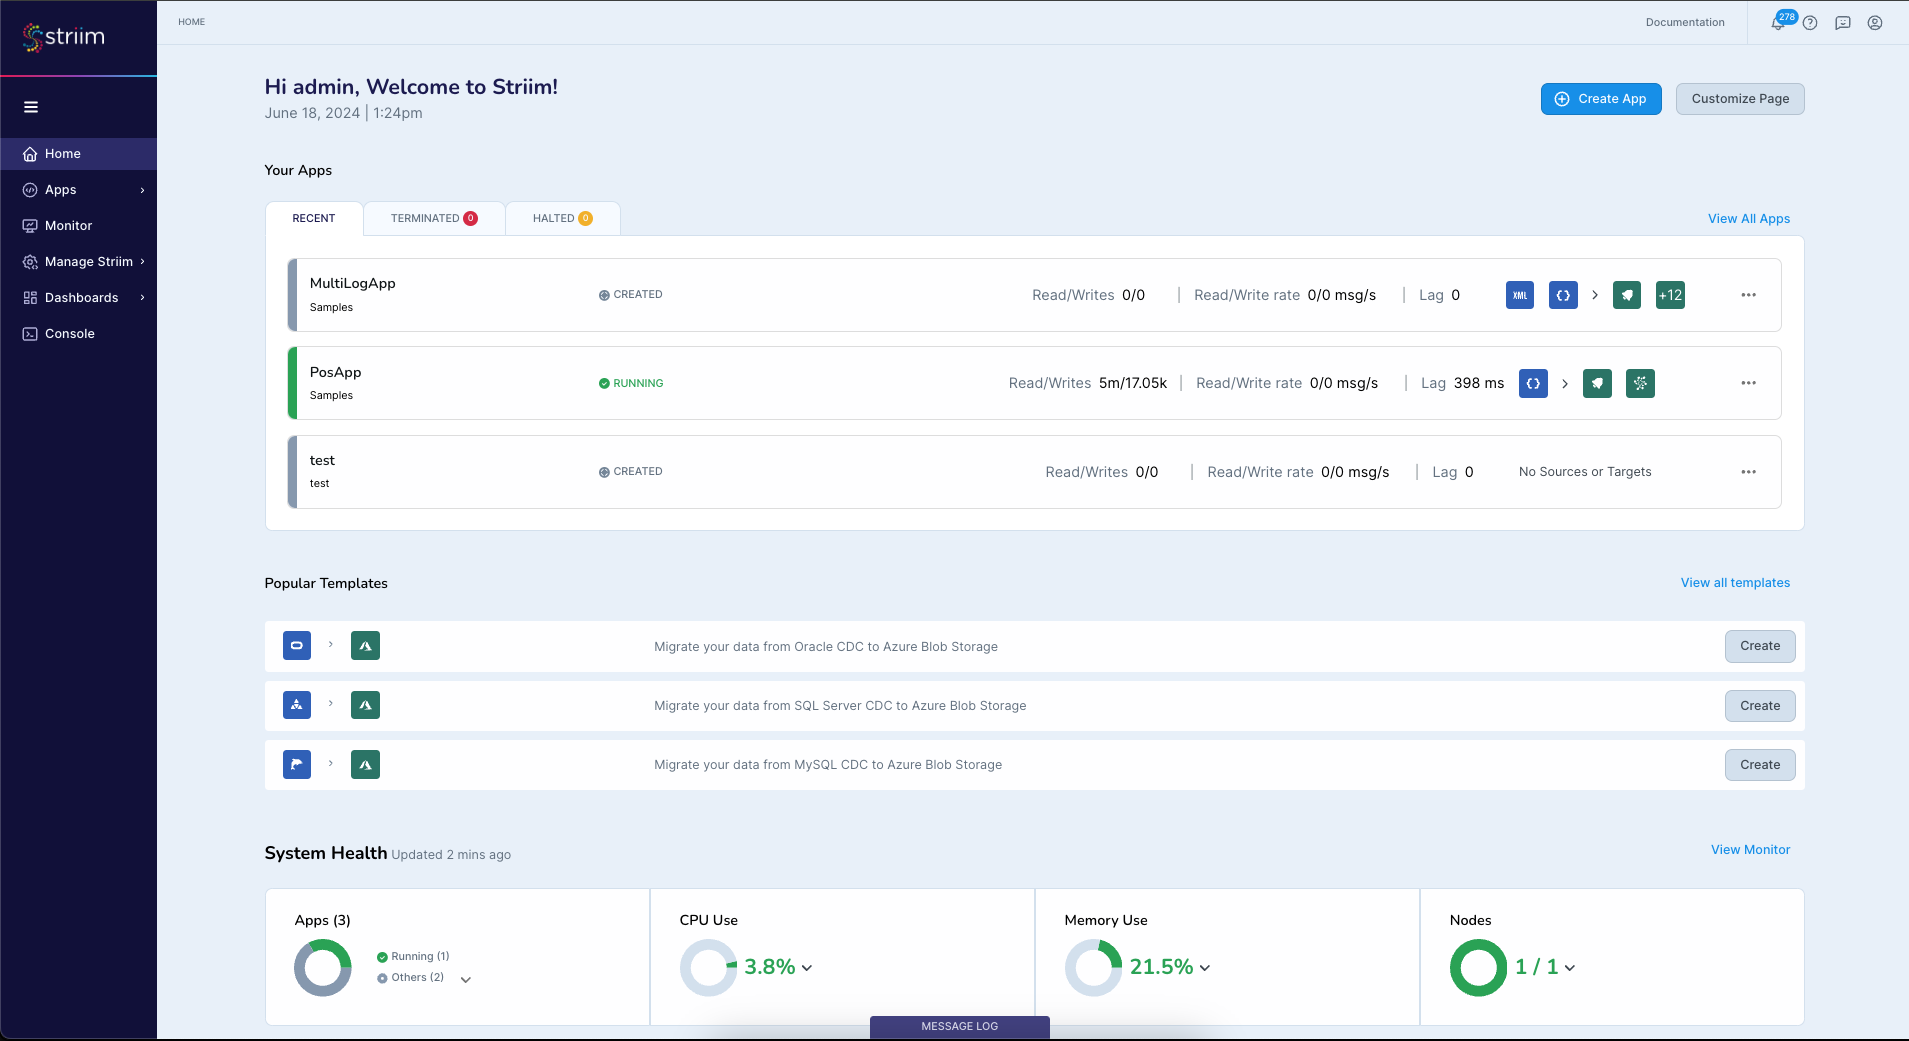
Striim's home page appears when you log in. This page gives you a summary of system status, alerts for any potential problems, and quick access to some of the resources you most recently accessed. What you see on this page will depend on your roles; click Customize Page to change it.
App Wizard page
Apps page
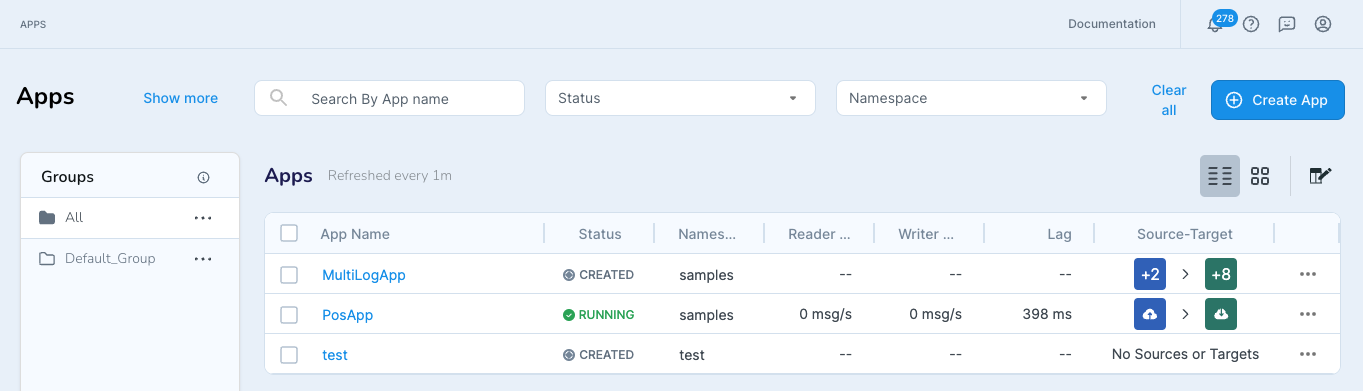
All currently created, deployed, and running applications for which you have read permission appear on the Apps page. The search box at the top allows you to find apps by name, status, and/or namespace.
Click Create App to create an app from scratch or by importing TQL. For more information on creating apps, see Fundamentals of TQL programming, Creating apps using wizards, Creating and modifying apps using the Flow Designer, and Creating a source using Source Preview.
Note
When importing a TQL file, the web browser process must have all necessary privileges on the file. For example, in a Linux environment, if the files are owned by root, and you are logged in as another user, you may be able to select the files for import but they will not actually be created. There is a 10MB file size limit when importing TQL using the web UI.
The entry for each application shows its current state (see Application states), some performance data, and icons for its sources and targets. States are color-coded: gray for Created, blue for Deployed, Stopped, or Quiesced, green for Running, red for Terminated or Halt, and so on. The namespace is displayed below the name of the application.
Use the ... menu to deploy, start, monitor, stop, undeploy, or drop an application, export it to a TQL file, move it to a group, or view it in the Flow Designer. The choices on the menu vary depending on the application's status: for example, Start appears only when the status is Stopped, and Drop appears only when the status is Created. Depending on your permissions, some menu choices may not appear.
If an application halts or terminates due to an error you can fix without undeploying it, such as by restarting an external source that has gone down, you may use the Resume command to continue after resolving the problem.
Optionally, personalize your Apps Page by grouping applications. To create a group, select Move to a group from the ... menu, enter a name for the group, and click Save. Alternatively, select multiple apps to act on at once using their checkboxes. Once you have created a group, use the same command to add additional applications. Click the up and down arrows to reorder groups, the pencil to rename or add a description, ∨ to collapse a group, > to expand, and ⓧ to delete a group (the apps will not be deleted).
To export an application to a TQL file, select ... > Export to TQL. Alternatively, select multiple apps using their checkboxes, then click Export (on the right, just below the search box.
Console page
Create App page
See Creating an app using the Flow Designer, Creating apps using wizards, or Creating apps by importing TQL.
Dashboards page
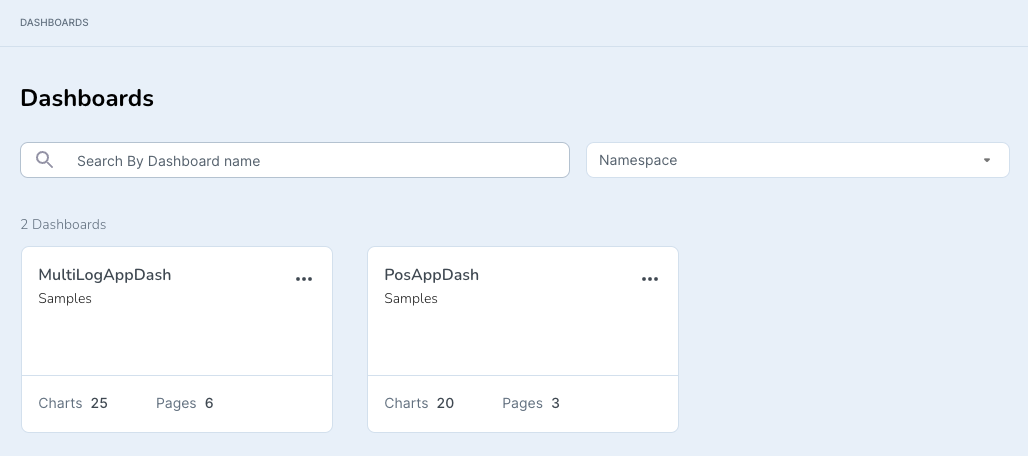
All currently loaded dashboards appear on the Dashboards page. Click a dashboard tile to view it. (If the associated application is not running, you will see errors.)
To import or create a new dashboard, click Add Dashboard. Use the ... menu to rename, edit, or delete a dashboard (depending on your permissions, some menu choices may not appear). The Export command appears at the top right when you edit the dashboard.
For more information, see the Dashboard Guide.
Flow Designer page
Manage Striim - Alerts
Manage Striim - Connection Profiles
See Connection profiles.
Manage Striim - Files
This page lets you upload and download files to and from Striim.
Select Manage Striim > Files > Upload FIle.
Select the directory to which you want to upload the file.
Drag and drop the file onto the dialog (or click Browse, navigate to the file, and double-click it), then click Done.
Select Manage Striim > Files.
Fine the file and click its Download File link.
Manage Striim - Metadata Manager
The Metadata Manager lets you browse all existing components you have permission to view. You may filter the list by namespace, application, and type. You may also view the Metadata Manager while in the Flow Designer, which can be useful when you want to copy settings from a component in another application or flow.
Manage Striim - Property Sets
This page lets you create the property sets required for Sending alerts from applications, Using LDAP authentication, or persisting streams to an external Kafka server (see Configuring Kafka for persisted streams) using the web UI.
Manage Striim - Property Variables
This page lets you create property variables using the web UI. See CREATE PROPERTYVARIABLE for more information.
Manage Striim - Shield Profiles
Manage Striim - Users + Roles
Administrators (members of the Global.admin group) can access this page to perform the tasks described in Managing permissions and roles.
Manage Striim - Vaults
This page lets you manage vaults using the web UI. See Using vaults for more information.
Message Log
The Message Log appears at the bottom of all web UI pages. Any errors in your applications or dashboards will appear here, along with notifications of various common events, including, among others:
system
all system apps are running (after server start)
adapters
events:
first event received (after application start)
millionth event received
10-millionth event received
connections:
initial connection established
retrying connection
reconnection successful
connection failed, application halted
Database Reader: initial load completed
targets when schema evolution is enabled (see Handling schema evolution)
DDL operation propagated
DDL operation ignored
unsupported DDL operation, application quiesced or halted
CDC readers
all metadata has been fetched
when schema evolution is enabled (see Handling schema evolution)
DDL operation captured
DDL operation ignored
unsupported DDL operation, application quiesced or halted
Oracle Reader
out-of-order SCN encountered
total open transactions has exceeded 10,000
transaction buffer has started spillover to disk
Metadata Manager page
Monitor page
My Files
Source Preview page
The Source Preview page allows you to create sources and caches by browsing available data files of certain types. See Creating a source using Source Preview.