Hands-on quick tour
This tour will give you a quick hands-on look at Striim's dashboards, Source Preview, Flow Designer, and more.
If you already have Striim Platform installed and running, continue with Viewing dashboards.
Otherwise, see Install Striim Platform for evaluation purposes.
Viewing dashboards
Select Apps > View All Apps.
If you don't see PosApp, select Create App > Import TQL file, navigate to
Striim/Samples/PosApp
, double-click PosApp.tql, enterSamples
as the namespace, and click Import.At the bottom right corner of the PosApp tile, select ... > Deploy > Deploy.
When deployment completes, select ... > Start. The counter on the bell (alert) icon at the top right should start counting up, indicating that alerts are being generated.
From the top left menu, select Dashboards > View All Dashboards > PosAppDash.
It may take a minute for enough data to load that your display looks like the following. The PosApp sample application shows credit card transaction data for several hundred merchants (for more information, see PosApp).

Hover the mouse over a map or scatter plot point, bar, or heat-map segment to display a pop-up showing more details.
Click a map or plot point to drill down for details on a particular merchant:

To return to the main page, click Samples.PosAppDash in the breadcrumbs:

You can filter the data displayed in the dashboard using page-level or visualization-level text search or time-range filters.

With the above text search, the dashboard displays data only for Recreational Equipment Inc.

Click the x in the search box to clear the filter.
To try the time-range filter, click the filter icon at the top right of the scatter chart, select StartTime, and set the dialog as shown below:
Filter: select is between
Value: Enter
2013-03-12
and8:45pm
as the from start date and time, and2013-03-12
and9:00pm
as the to date and time.Click Apply.

Click Clear to clear the filter.

When you are through exploring the dashboard, continue with Creating sources and caches using Source Preview.
Creating sources and caches using Source Preview
Source Preview is a graphical alternative to defining sources and caches using TQL. With it, you:
browse regular or HDFS volumes accessible by the Striim server
select the file you want
select the appropriate parser (Apache, structured text, unstructured text, or XML)
choose settings for the selected parser, previewing the effects on how the data is parsed
generate a new application containing the source or cache, or add it to an existing application
For sources, Source Preview will also create:
a CQ to filter the raw data and convert the fields to Striim data types
a stream of type WAEvent linking the source and CQ
an output stream of a new type based on the parser settings you chose in Source Preview
Create a source
The following steps create a source from the sample data used by PosApp:
Select Apps > Create New > Source Preview > Samples > PosDataPreview.csv > Preview.
Check Use first line for column names and set columndelimiter to
,
(comma).PosApp uses only the MERCHANTID, DATETIME, AUTHAMOUNT, and ZIP columns, so uncheck the others.
Set the data types for DATETIME to DateTime (check Unix Timestamp) and for AUTHAMOUNT to Double. Leave MERCHANTID and ZIP set to String.
The data is now parsed correctly, the columns have been selected, and their names and data types have been set, so click Save.
For Name enter PosSourceApp.
If you are logged in as admin, for Namespace enter PosSourceNS. Otherwise, select your personal namespace. Then click Next.
For Name enter PosSource, then click Save.
The new PosSourceApp application appears in the flow editor.

At this point you could add additional components such as a window, CQ, and target to refine the application, or export it to TQL for use in manually coded applications.
Add a cache
The following steps will add a cache to the PosSourceApp application:
Download USAddressesPreview.zip from github.com/striim/doc-downloads and unzip it.
Select
> My Files, click Select File next to No File Selected (not the one next to Cancel), navigate to and double-click USAddressesPreview.txt, and click Upload and Select
Select Apps > Create New > Source Preview > Browse, select USAddressesPreview.txt, and click Select File.
Check Use first line for column names, set columndelimiter to
\t
(tab), set the data type for latVal and longVal to Double, and click Save.Select Use Existing, select PosSourceApp, and click Next.
Select Create cache, for Name enter ZipCache, for Cache Key select Zip, leave Cache Refresh blank, and click Save.
Warning
If you save as a cache and deploy the application, the entire file will be loaded into memory.
Continue with Modifying an application using the Flow Designer.
Modifying an application using Flow Designer
The instructions in this topic assume you have completed the steps in Creating sources and caches using Source Preview and are looking at PosSourceApp in Flow Designer:

We will enhance this application with a query to join the source and cache and populate a target and WActionStore.
Collapse Sources and expand Base Components.
Click WActionStore, drag it into the workspace, and drop.
Set the name to PosSourceData.
Click in the Type field and enter PosSourceContext as a new type.
Click Add Field four times.
Set the fields and data types as shown below. Click the key icon next to MerchantId to set it as the key for PosSourceContext.
Add four more fields as shown below.
Click the Save just below the types (not the one at the bottom of the property editor).
Set Event Types to PosSourceContext, set Key Field to Merchant ID, and click Save (the one at the bottom of the property editor).
Drag a continuous query (CQ) into the workspace.
Set the name to GenerateWactionContext.
Enter or paste the following in the Query field:
SELECT p.MERCHANTID, p.DATETIME, p.AUTHAMOUNT, z.Zip, z.City, z.State, z.LatVal, z.LongVal FROM PosSource_TransformedStream p, ZipCache z WHERE p.ZIP = z.Zip
Set Output to Existing Output and PosSourceData. The configuration dialog should look like this:
Click Save. The application should look like this:
The status should now show Created. Select Deploy App > Deploy.
When the status changes to Deployed, select the stream icon below GenerateWactionContext, then click the eye icon or Preview On Run. The data preview pane will appear at the bottom of the window.
Click Deployed and select Start App. Counts will appear above each of the application's components indicating how many events it is processing per second. (Since this application has a small amount of data, these counts may return to zero before they are refreshed. Run MultiLogApp for a larger data set where the counts will be visible for longer.)
The first 100 events from the GenerateWactionContext output stream will be displayed in the preview pane.
At this point, the WActionStore contains data, so we can query or visualize it. Continue with Browsing data with ad-hoc queries.
Browsing data with ad-hoc queries
Ad-hoc queries let you do free-form queries on WActionStores, caches, or streams in real time by entering select statements in the Tungsten console. The syntax is the same as for queries in TQL applications (see CREATE CQ (query)) .
The following example assumes you performed the steps in Modifying an application using the Flow Designer, including deploying and starting the application.
Open a terminal window and start the Tungsten console. If Striim is installed in
/opt
, the command is:/opt/Striim/bin/console.sh
Log in with username
admin
and the password you provided when you installed Striim.At the W (admin) > prompt, enter the following:
select * from PosSourceNS.PosSourceData;
You should see something like the following:[ MerchantId = Mpc6ZXJBAqw7fOMSSj8Fnlyexx6wsDY7A4E DateTime = 2607-11-27T09:22:53.210-08:00 Amount = 23.33 Zip = 12228 City = Albany State = NY LatVal = 42.6149 LongVal = -73.9708 ] [ MerchantId = Mpc6ZXJBAqw7fOMSSj8Fnlyexx6wsDY7A4E DateTime = 2607-11-27T09:22:53.210-08:00 Amount = 34.26 Zip = 23405 City = Machipongo State = VA LatVal = 37.4014 LongVal = -75.9082 ]
Press Enter to exit the query.
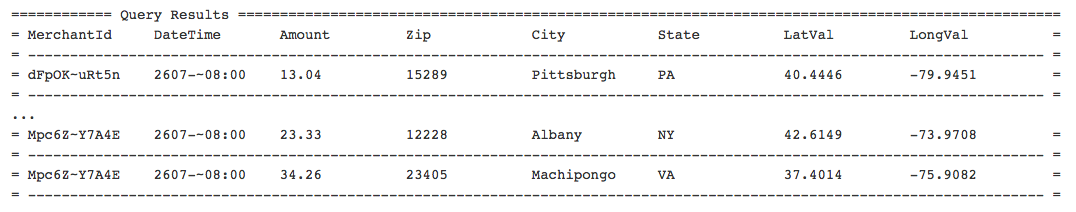
If you prefer, you can see the data in a tabular format. To try that, enter:
set printformat=row_format;
Press cursor up twice to recall the query, then press Enter to run it again. You should see the following (if necessary, widen the terminal window to format the table correctly):
![]() |
To switch back to the default format:
set printformat=json;
Continue with Creating a dashboard.
Creating a dashboard
In Viewing dashboards you saw the dashboard of the PosApp sample application. Now you will create one from scratch.
The following instructions assume you completed the steps in Modifying an application using the Flow Designer and Browsing data with ad-hoc queries and that the application is still running.
From the main menu, select Dashboards > View All Dashboards.
Click Add Dashboard, for Dashboard Name enter
PosSourceDash
, for Namespace select PosSourceNS as the namespace, and click Create Dashboard. A blank dashboard will appear.To add a visualization to the dashboard, drag a Vector Map from the visualization palette and drop it on the grid.
The first step in configuring a dashboard is to specify its query: click Edit Query.
In the Query Name field, enter
PosSourceNS.PosSourceDataSelectAll
, edit the query to readselect * from PosSourceData;
and click Save Query.Click Configure (the pencil icon).
Set the map properties as shown above, then click Save Visualization.
Since the data is all in the continental United States, you might want to edit the settings to center it there. You could also change the Bubble Size settings so that the dots on the map vary depending on the amount.
Click Configure again, change the settings as shown above, click Save Visualization, then refresh your browser to apply the new zoom settings.
Experiment with the settings or try more visualizations if you like. For more information on this subject, see Dashboard Guide.
Continue with Exporting applications and dashboards
Exporting applications and dashboards
To save the work you have done so far, you can export the application and dashboard to files.
From the upper-left menu, select Apps.
From PosSourceApp's ... menu, select Export.
Click Export (since the app contains no Encrypted passwords, do not specify a passphrase).
Optionally, change the file name or directory, then click Save.
From the top menu, select Dashboards > View All Dashbaords.
Click PosSourceDash.
Select Export. Optionally, change the file name or directory, then click Save.
You may import the exported application TQL file and dashboard JSON file to any namespace. Note that for the dashboard to work you must import it to the same namespace as the application.
You may edit the exported TQL file as discussed in Programmer's Guide.
What next?
See Web UI Overview for a look at additional Striim features.
Run the CDC demo applications to explore Striim's data migration capabilities (see Running the CDC demo apps).
If you do not plan to write Striim applications but would like to create or modify dashboards, continue with the Dashboard Guide and PosAppDash in the Programmer's Guide.
Note
The Striim platform's TQL programming language is in many ways similar to SQL, particularly as regards SELECT statements. The Programmer's Guide assumes basic knowledge of SQL.
To learn to write Striim applications, continue with Programmer's Guide.